Thursday, November 30, 2023

Girish’s Real Estate Market Observer - Nov '23 Edition

 Girish’s Real Estate Market Observer

 Who will bail out the buyers?


Challenging is not the word to describe the home buyer’s world in the Bay Area. It’s brutal and has been so for many years. The inventory of homes (combined Alameda and Contra Costa County) continues to be anemic (sellers being locked into low-interest rates and seasonal factors). At the same time, the inventory has picked up month-over-month since February 2023 (Fig 1); it’s not enough compared to the demand. The net result is no different from the last few months, and prices remain steady, dipping ever so slightly (Fig 2). Of course, many neighborhoods are attracting multiple offers and bidding wars. It shows that the Bay Area buyers are willing and capable of shelling out money from their deep pockets. Higher interest rates are now a distant memory. Talking about it, the market is more sensitive to changes in interest rates rather than absolute numbers. So, watch the interest rates (Fig 3) as you move forward. The buyers are expected to return to the market after the holidays, and if the inventory of homes stays where it is, next year will be more competitive and less forgiving for the buyers.

So, let’s get back to the question: who will bail out the buyers? 

1. Supply is not going to improve overnight (the sellers are sitting tight, and the cities are not doing much to help build new homes)

2. Higher or lower interest rates are not the solution, especially when the supply is low. There are enough buyers no matter what the interest rates are

3. Economic shock and related turmoil in the job market - loss of jobs and an eventual inventory glut. Sorrow for many and opportunity for some. Will that happen? My answer is as good as yours.

Contact me if you need in-depth real estate market analysis for your city. 

Figure 1: Combined For Sale and Sold SFRs, Contra Costa, and Alameda County.


Figure 2: Median Sale Price of SFR in Alameda and Contra Costa County.


Figure 3: Average 30-Year Fixed Mortgage Rates.


Monday, October 23, 2023

Girish's Real Estate Market Observer - October '23 Edition

 Seller and Buyer Tug of War

Envision a metaphorical tug of war, a fierce battle between two formidable teams - the sellers and the buyers. The rope symbolizing this struggle is the mortgage interest rate. Unlike the conventional tug of war, this rope is not a passive participant but rather a dynamic force in real estate. It shifts its position in response to the stronger pull, exerting a considerable influence on the outcome of this confrontation.

Presently, the dynamics of this force are causing sellers to adopt a cautious stance, restraining them from putting their properties on the market. This hesitancy is primarily because many sellers are locked into historically low-interest rates, often below 3%. Simultaneously, this dynamic force is compelling potential buyers to hesitate or abandon their pursuit of homeownership. The consequence of this standoff is a delicate equilibrium between supply and demand, which keeps home prices upward.

In the combined areas of Contra Costa County and Alameda County, the median sale price of Single-Family Residences (SFR) demonstrated year-on-year (Y-O-Y) and month-on-month (M-O-M) increases in September (refer to Figure 1). This upward price trend is taking place against the backdrop of a continuous Y-O-Y decline in the inventory of available homes and the number of properties sold (as illustrated in Figures 2 and 3). However, September witnessed an unexpected M-O-M surge in property supply, an occurrence not commonly associated with the holiday season's approach. Is this a subtle indication that sellers are relenting, choosing to let go of their precious sub-3 % mortgage rates? Only time will reveal the true nature of this development. If increasing inventory persists through December, it could alleviate some pressure on buyers and exert a downward force on home prices.

For the real estate market to witness a fundamental transformation in determining the victor of this tug of war, one or more of the following scenarios must unfold:

1. The rope, symbolizing the interest rate, must break, and we shall observe who succumbs first with a resounding thud. Both buyers and sellers may find themselves in a precarious position.

2. Alternatively, either the sellers or the buyers may concede defeat. The pivotal question is, which side will emerge victorious? In the Bay Area, at least, prospective buyers with substantial financial resources actively pursue properties.

In recent memory, the Bay Area real estate market experienced two periods of better balance: when buyers had access to reasonable inventory, favorable mortgage interest rates, and property prices that remained within reach. The first period occurred between July 2018 and November 2019 (as reflected in Figures 4 and 5), and the other transpired between July 2022 and February 2023 (as demonstrated in Figures 6 and 7). Figures 4, 5, 6, and 7 unequivocally portray the stark contrast in property prices, inventory levels, and interest rates (as seen in Figure 8) between those periods and the current state of affairs.

In conclusion, it is imperative to maintain a vigilant watch over the pulse of the real estate market, as it is the key to discerning the direction in which the market is poised to move.


Figure 1: Combined Median Sale Price, Contra Costa, and Alameda County.


Figure 2: Combined Inventory of SFR in Alameda and Contra Costa County.


Figure 3: For Sale and Sold SFRs in Alameda and Contra Costa Counties


Figure 4: For Sale and Sold SFRs in Alameda and Contra Costa Counties (July 2018 – Nov 2019)


Figure 5: Median Sale Price of SFRs, Alameda and Contra Costa Counties combined (July 2018 - Nov 2019)


Figure 6: For Sale and Sold SFRs in Alameda and Contra Costa Counties (July 2022 – Feb 2023)


Figure 7: Median Sale Price of SFRs, Alameda and Contra Costa Counties combined (July 2022 – Feb 2023)


Figure 8: 30-Year Average Fixed Mortgage rates during July 2018 – Nov 2019 and July 2022 – Feb 2023 periods


Saturday, September 30, 2023

Girish's Real Estate Market Observer - September '23 Edition

September '23 Market Update


Before winter's chill, the Residential Real Estate (RRE) sector within the Bay Area appears uncertain, struggling to ascertain its direction. Various macro and microeconomic variables exert divergent forces upon the RRE market. Whether attributed to the absence of available Inventory, with sellers seemingly constrained by the enticing allure of historically low interest rates or the reluctance of prospective buyers stemming from the diminished affordability arising from elevated interest rates and the apparent reluctance of home prices to exhibit significant fluctuations following the notable surge experienced over the two years after the onset of the COVID-19 pandemic. The Federal Reserve, for its part, does not indicate an imminent reduction in interest rates but rather alludes to the possibility of future rate hikes. There exists a need for a decisive shift to invigorate the real estate market. The outcome of this standoff remains uncertain, and while one may only speculate, if one were to place faith in mathematical principles and subscribe to the concept of regression to the mean, it is plausible to anticipate that the remarkable appreciation of over 40% within the two years following the COVID-19 pandemic will inevitably necessitate a correction, rather than a steep crash. It is foreseeable that a considerable period will be required for inventory levels to normalize, for pricing adjustments to materialize, and for enhanced affordability to emerge gradually. An examination of pertinent data is warranted better to comprehend the present impasse between supply and demand dynamics.


Figure 1: Existing Home Sales Decline


Home sales (number of transactions) have reduced over the year by a whopping 18.3% Year-To-Year.


Figure 2: Inventory of Homes Decline


Inventory of Homes Decline by 23.5% Year-To-Year in the Bay Area


Figure 3: Median Sale Price Increase


With a substantial dip in Inventory, the prices continue to hold, with a 5% increase Year over Year and almost stable Month over Month (July 2023 to August 2023).


Figure 4: Monthly MortagagePayment


With the increase in interest rates over the last year, even though the prices have come down compared to the peak in March/April 2022, the monthly mortgage payment has substantially increased.


Figure 5: Home Affordability Index


The Home Affordability Index quantified the proportion of households capable of purchasing a median-priced dwelling, which has regrettably dwindled to a meager 19%. This starkly contrasts the situation observed in Q1-2012 during the aftermath of the 2008-2012 economic downturn when a considerably more substantial 45% of households had the financial means to acquire a residence at the median price point. The challenges confronting prospective homebuyers primarily revolve around the issues of affordability and the persistent shortage of Inventory. The resolution of this problem hinges upon a singular trajectory: the augmentation of housing inventory. This, in turn, necessitates a catalyst, which could manifest in either an unforeseen economic upheaval or the establishment of an appealing interest rate threshold that motivates homeowners to consider listing their properties for sale. Speculation abounds regarding the forthcoming events and invites contemplation on the subject. We welcome your insightful perspectives and encourage you to share your thoughts in the comments below.


Saturday, August 12, 2023

Girish's Real Estate Market Observer - August '23 Edition

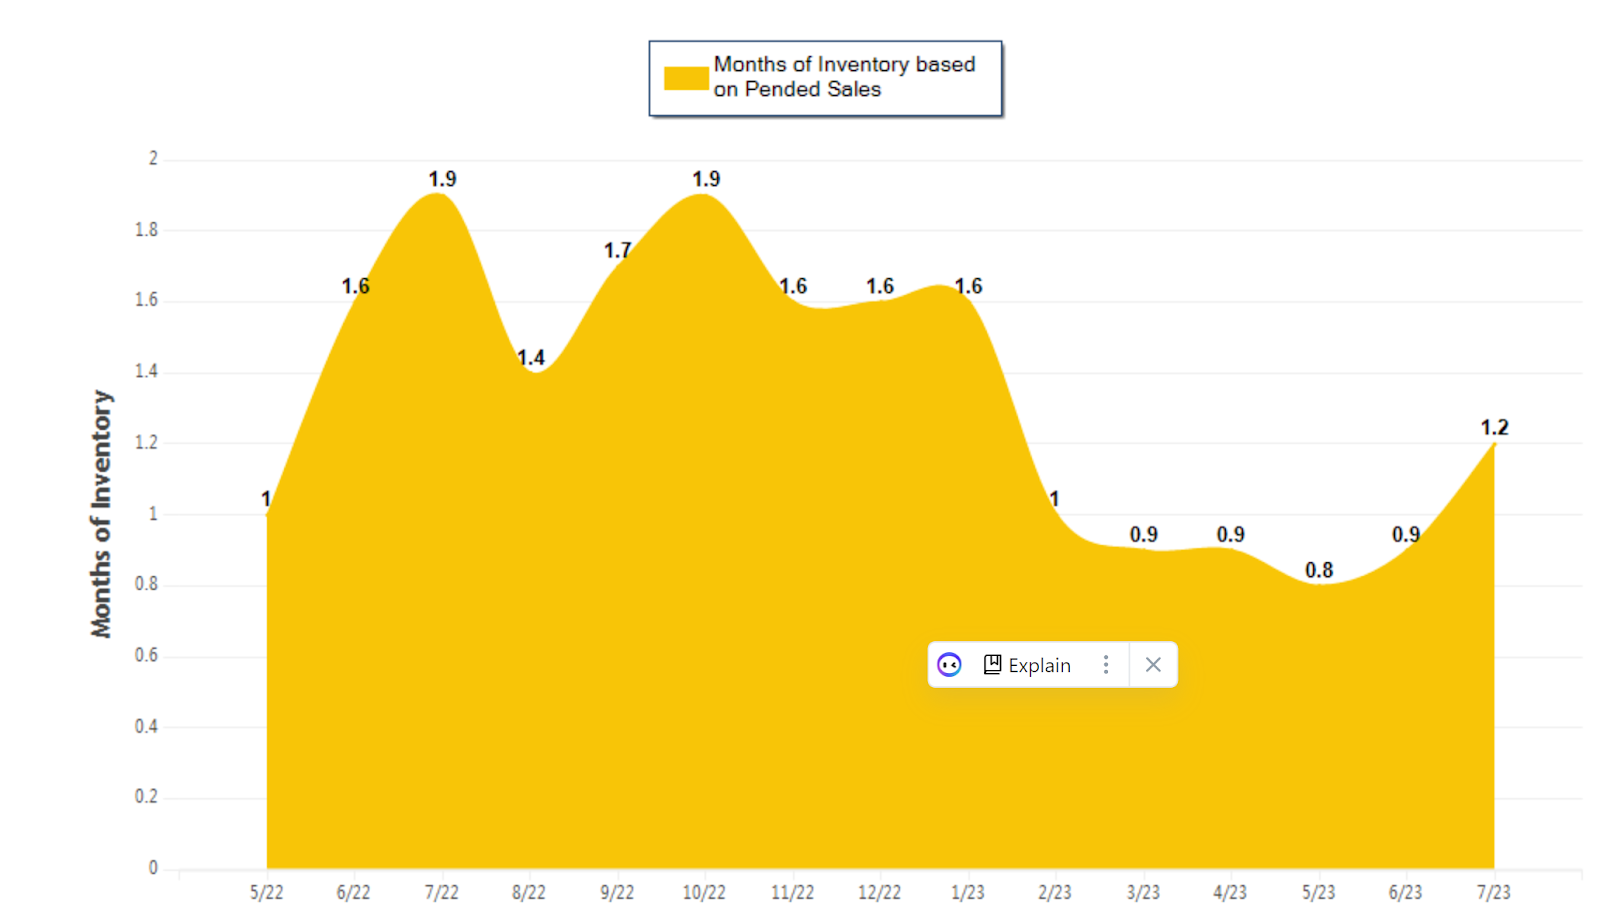
In the July ‘23 update, we delved into the shifting landscape of median sale prices and their interaction with interest rates for single-family homes in Contra Costa and Alameda counties combined. Despite a decline in the median sale price, the impact of rising interest rates has caused monthly payments to remain elevated. This month, our focus turns to the influence of inventory levels on buyer demand within these two counties. (Please don't hesitate to reach out if you require data for other Bay Area counties or cities – I'm here to assist.) Let's dive into the details, including figures and the accompanying graph.

 **Months of Inventory based on Pended Sales in July 2023: 1.2 Months**

- This marks a 33.1% increase when compared to the previous month.

- However, juxtaposed against last year's same month, it demonstrates a notable 37.6% decrease.


July 2023 experienced a surge in inventory compared to June 2023, offering buyers a slight respite. It's worth noting that July of this year witnessed an extraordinary 37.6% decline in inventory compared to July of the prior year. The conventional wisdom suggests that an escalation in interest rates should naturally dampen demand (a strategy that the Federal Reserve employs to influence the broader economy). However, the existing dearth of supply continues to fuel a heated market, ensuring buyers still grapple with multiple offers and competitive bidding wars. While the extended period of the Bay Area housing bull market since 2012 has seen intermittent lulls, the pent-up demand consistently regains momentum. This phenomenon was observed between July and December of the previous year when potential buyers hesitated on the sidelines following three consecutive interest rate hikes. Notably, most of these buyers resurfaced in January of the current year, overcoming their initial apprehensions and adjusting to the revised rates.

For a broader context, please examine the inventory levels dating back to 2018, a pivotal juncture at the outset of the housing bubble burst.


- A buyer's market entails more than 6 months of inventory, based on pended sales.

- Conversely, a seller's market is characterized by less than 3 months of inventory, per pended sales data.

Based on pended sales, a balanced or neutral market corresponds to a range of 3 to 6 months of inventory.

Remember that these parameters can exhibit variability across distinct geographical areas.

For any further inquiries or insights, do not hesitate to contact me. I remain at your disposal.

Tuesday, July 4, 2023

In examining the combined data for Alameda and Contra Costa County, Single Family Homes, it is evident that the median sale price has experienced a decline from $1.325 million in May 2022 to $1.135 million in May 2023.


However, contrary to what might be perceived as good news for buyers, the situation is not as favorable as it initially appears. The average 30-year fixed interest rate at the end of May 2022 stood at approximately 5%. This equated to a principal and interest (P&I) payment of $5,690 per month for a median-priced property ($1.325 million) with a 20% down payment. In contrast, today's median-priced property of $1.135 million, with an average interest rate of around 7% (roughly), would result in a higher P&I payment of $6,041 per month (calculated with 20% down).


When considering these figures, it becomes apparent that although the median sold price decreased by 14.3% from May of last year to May of this year, the monthly mortgage payment has increased by 6.2%. Consequently, prices today are higher than during the same period last year.


Nevertheless, there is a silver lining in the form of potential refinancing opportunities. As interest rates decrease, homeowners can refinance their mortgages, reducing their monthly payment burden while having already secured a property. Additionally, a decrease in interest rates tends to attract more prospective buyers.


In summary, despite the decline in the median sale price, the increase in monthly mortgage payments suggests that the current housing market conditions may not necessarily favor buyers. However, the possibility of refinancing and the potential for future lower interest rates could provide some relief and attract more buyers to the market by increasing the property values (assuming inventory does not increase substantially).


Girish Bangalore

DRE# 02067090

INTERO

(408) 420-0646

https://girishbangalore.agent.intero.com/2023/07/04/market-update-july-2023-alameda-and-contra-costa-counties-combined


Wednesday, May 13, 2020

Real Estate Market Post Shelter-In-Place

I have been conducting Zoom Webinar’s with a data-driven presentation giving insights into the current market, post Shelter-In-Place, comparing the scenario with 2008 and outlook for the future. I will be thrilled to have a one-on-one or group Zoom sessions with you and your friends and family, and it should take 45 – 60 mins and I will ensure that your time is well spent. Please reply to this email if you are interested so that I can schedule one for you.

Below is a graph of what’s happening in Contra Costa and Alameda counties Real Estate market combined, this is a graph of Supply (New Listings) and Demand (Pending sales), each data set is for two weeks starting with two weeks before Shelter-In-Place became effective, followed by Weeks 1-2, 3-4, 5-6 and 7-8 after Shelter-In-Place became effective. The following are the salient points that can be interpreted from the graph.

  1. Both Supply and Demand came down significantly in the immediate two-week period post Shelter-In-Place, showing that the dramatic change in their lifestyle rattled buyers and sellers and anxious about the future
  2. Supply started to go up immediately after the first two weeks and has continued to do so, indicating that Seller’s have overcome the initial anxiety and re-adjusted to the new situation, both personal and professional.
  3. Though demand went down for a second consecutive two-week period, it jumped up significantly in the subsequent two two-week periods.
  4. Both Supply and Demand are now inching up to the pre Shelter-In-Place numbers.

Many of you might have been aware that January and February of 2020 were brutal for buyers, with Supply being meager and buyers clamoring to buy the limited inventory, leading to a bidding war and significant overbidding. On average, during Jan-Feb of this year, I had a 20% acceptance rate of offers, multiple offers on all properties that I had submitted on behalf of my buyers (average of 10 offers per property), with a couple of homes getting 40+ offers. Properties that did not sell in 2019, subsequently taken off-market and then re-listed in Jan-Feb, were getting sold within a week. Overall, it was a tight market for buyers. With inventory still way low in Bay Area (2 months or less Supply where less than six months supply is considered a Seller’s market) and buyers coming back to the market as seen in the graph below, it is going to be very competitive for buyers if the trend continues.

I hope the above summary and the graph below gives you a proper perspective of today’s market. If you have any further questions or would like to set up a Zoom call on the complete market presentation, you may reply to this email, and I will be delighted to talk to you.


Thursday, May 16, 2019

Bay Area RE Market Update - May 2019

Hello Friends,

My May market update is the blog post from Tom Tognoli, who is the co-founder and former CEO of Intero. Tom has gracefully consented to post his blog on mine and it aptly fits into my bi-monthly RE market update. A link is provided at the end of the article to Tom's own blog. Happy Reading. As always call me, text me or email me if you or anyone you know are in the market to buy or sell a property. Thank You!

Don't Freak: San Francisco Bay Area home prices fall for the first time in 7 years

May 16, 2019

First, don't freak out...it's old news. In Q1 of last year (2018) the Bay Area housing market went a bit crazy. Depending on where you live, it's like the real estate market got a jolt of adrenaline at the end of Q1 last year. Property values literally shot up 10% to 15% in 90 days. It was stupid and unsustainable.

In Q2 of 2018, reality set in and property values gave most of that 90-day gain back in what seemed like a week. It needed to happen. It literally all happened in weeks, not months or years. It happened so quickly most people didn't even notice.

Over the last year, property values have slowly ground their way up. Just not to those stupid prices of Q1 last year...yet. It was unhealthy.

I will warn you now, you may see property values are down year over year again this month and maybe even again next month as well. Next, I predict we will see values flatten out year over year going into the summer. Then, we will see property values climb slowly in the second half of 2019. Again...don't freak...it's all normal. Well...Bay Area normal :)

This is part of the reason I think last year was slower than some had hoped. We needed to get owners/sellers to come back to reality and that does not happen overnight. They held on to what their property was worth for a week or two in Q1 of 2018. That was not reality and if you were lucky enough to sell them, good for you.

On the other hand, if you bought in that week, don't freak out. Real estate is all about the long game, not the short game. You will be fine and happy you purchased and own a home. Just think about that ridiculously low-interest rate you got! Better than the 12% I had to pay on my first loan back in '89.
So, now what everyone wants to know...where do we go from here?

I am blessed to be able to spend time with some pretty smart and amazing people. I use that opportunity to pick their brains and then mix it with what I know. Most people feel solid about the economy and the prospects for Bay Area real estate. I'm putting my money where my mouth is and have been putting my money to work in real estate with my business partners.

It's hard to wrap your head around, but with all of the IPO's, the tech boom, low-interest rates, housing shortage, stock market grinding to new highs, commute traffic and more, I am still a buyer of Bay Area real estate. I don't see any significant changes in our market anytime soon. Ping me if you or anyone you know needs help, I know people :)
And don't freak out!

- Tom Tognoli

Link to original Post: http://bit.ly/30mHZAm